
Free, no signup
Open the Delhi simulator and start experimenting immediately. No account, payment or onboarding gate.
trafficlab.azonova.com
Open the map and start experimenting. No signup required. Sketch road edits, flyovers, underpasses, lane changes and signal ideas, then compare congestion, waiting time, cost, risk and urban mobility trade-offs.
Built for planners, civic-tech builders, students, journalists and Delhi NCR residents exploring traffic congestion ideas before real-world proposals.
Scenario flow
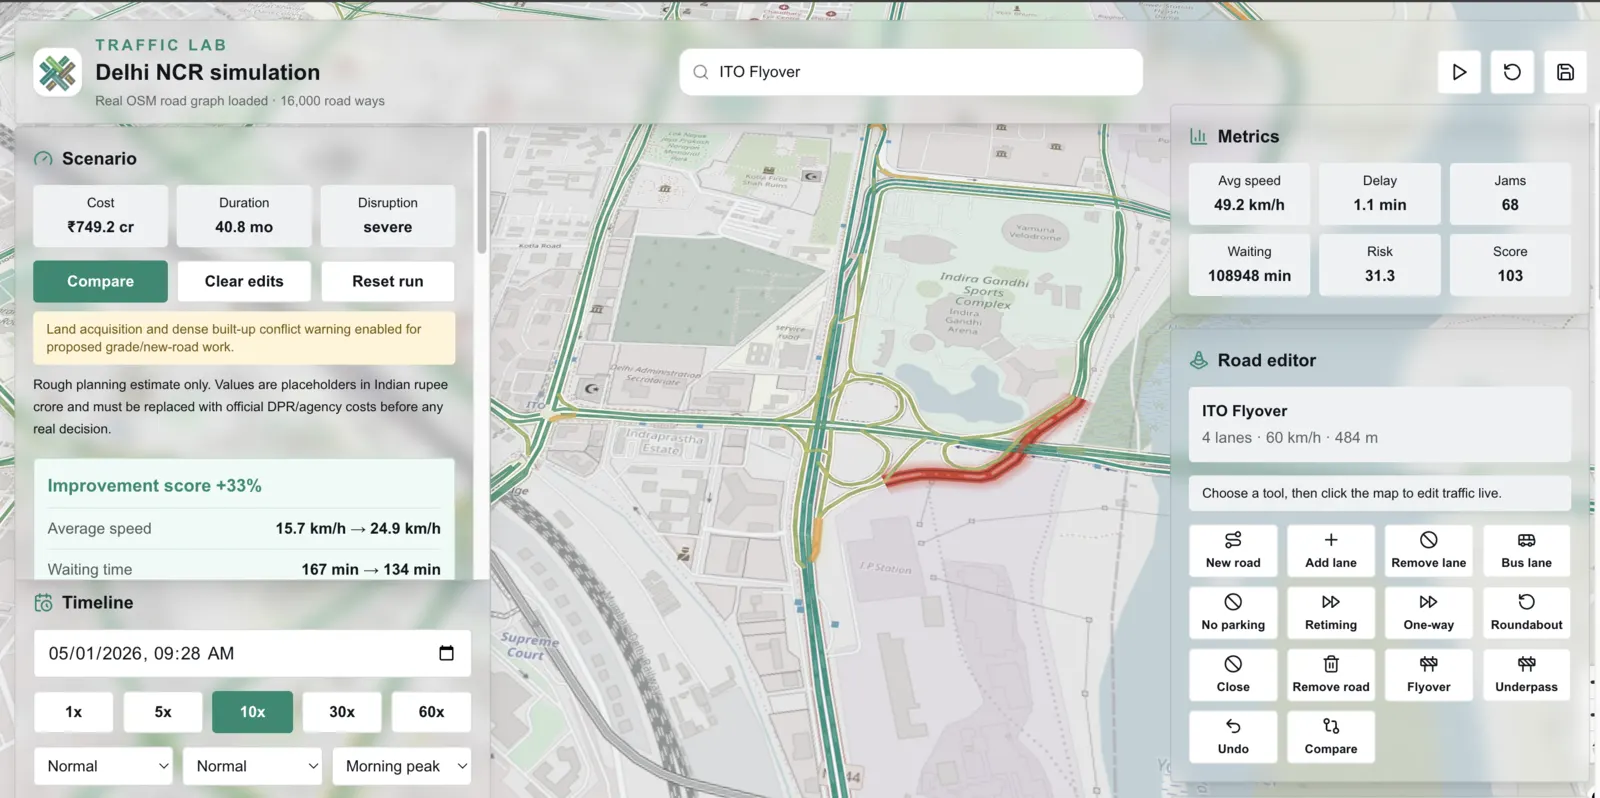
This preview uses the real simulator screen. The animation highlights the path: pick a corridor, draw a flyover, split traffic onto the new link, then watch the score update.
Open the Delhi simulator and start experimenting immediately. No account, payment or onboarding gate.
Draw roads, flyovers, underpasses and lane changes with start/end clicks; tune flyover approach lanes and roundabout size.
Compare speed, waiting time, jams, risk and cost with transparent formulas, reason codes and edit calculation modals.
Uses OpenStreetMap roads, pincode demand inputs and clearly labelled model proxies where observed datasets are not imported.
Learn before trusting outputs
Every visible number is documented: OD demand, V/C ratio, waiting time, speed, jams, accident risk, flyover approach-lane effects, open-space shortcut/environment cost, roundabout footprint, land assumptions, mode share, accessibility and city score.
How road edits, OD demand, V/C ratio, waiting time, cost, risk, mode share and scores are calculated.
Homepage links and current status for road, map, demand, cost and collector-rate data.
What Traffic Lab does not factor in yet and why results should be treated as planning estimates.
Read before using any simulation outputs for presentations, planning or decisions.
Outputs are for exploration and discussion. Validate with qualified transport planners and official datasets before action.
If you have ideas, corrections, data sources or bug reports, email contact@azonova.com.